Background
FHWA Transportation Performance Management
Safety Performance Targets (PM1)
FHWA Safety Performance Management
Caltrans Strategic Highway Safety Plan
FHWA State Safety Performance Dashboard and Reports
Performance Measures (Annual Targets)
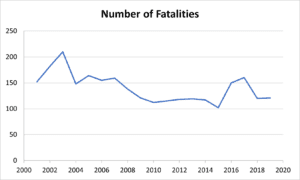
- Number of Fatalities
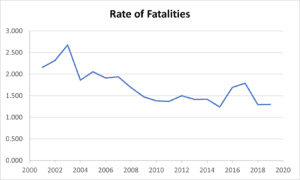
- Rate of Fatalities per 100 Million VMT
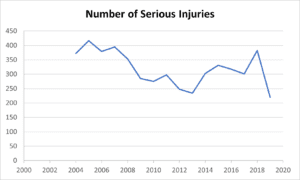
- Number of Serious Injuries
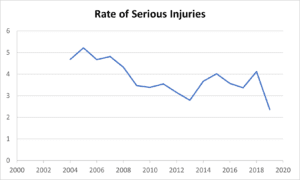
- Rate of Serious Injuries per 100 Million VMT
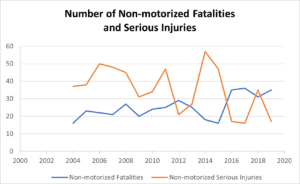
- Number of Non-Motorized Fatalities and Serious Injuries
2021 Targets
Fresno COG supported the statewide Safety Performance Management Targets (SPMT) for 2021
| Performance Target | Data Source | 5-Yr. Rolling Average |
| Number of Fatalities | FARS | 3,624.80 |
| Rate of Fatalities (per 100M VMT) | FARS & HPMS | 1.044 |
| Number of Serious Injuries | SWITRS | 15,419.4 |
| Rate of Serious Injuries (per 100M VMT) | SWITRS & HPMS | 4.423 |
| Number of Non-Motorized Fatalities and Non-Motorized Severe Injuries | FARS & SWITRS | 4,340.8 |
2020 Targets
Fresno COG supported the statewide Safety Performance Management Targets (SPMT) for 2020
| Performance Target | Data Source | 5-Yr. Rolling Average (2019) |
| Number of Fatalities | FARS | 3518.0 |
| Rate of Fatalities (per 100M VMT) | FARS & HPMS | 1.023 |
| Number of Serious Injuries | SWITRS | 13,740.4 |
| Rate of Serious Injuries (per 100M VMT) | SWITRS & HPMS | 3.994 |
| Number of Non-Motorized Fatalities and Non-Motorized Serious Injuries | FARS & SWITRS | 4147.4 |
Tracking Safety Performance in Fresno County
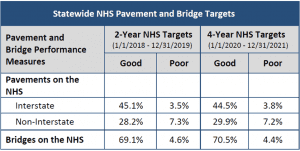
Pavement and Bridge Targets (PM2)
Caltrans Transportation Asset Management
Performance Measures (2-year and 4-year targets)
- % Interstate pavements in Good condition
- % Interstate pavements in Poor condition
- % Non-Interstate NHS pavements in Good condition
- % Non-Interstate NHS pavements in Poor condition
- % NHS bridges in Good condition
- % NHS bridges in Poor condition
2018-2021 Targets
Fresno COG support the following statewide targets set by Caltrans
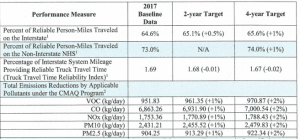
System Performance/Freight/CMAQ Targets (PM3)
Performance Measures (2-year and 4-year targets)
- % Reliable person-miles traveled on the Interstate.
- % Reliable person-miles traveled on the Non-Interstate NHS.
- Percentage of Interstate system mileage providing for reliable truck travel time. (Truck travel time reliability)
- Total emissions reductions by applicable pollutants under the CMAQ program.
2018-2021 Targets
Fresno COG support the following statewide targets set by Caltrans
Transit Asset Management (TAM)
FTA Transit Asset Management Rules
Performance Measures
- Revenue Vehicle: The percentage of revenue vehicles (by type) that exceed the useful life benchmark (ULB)
- Non-Revenue Vehicle: The percentage of non-revenue service vehicles (by type) that exceed the ULB
- Facilities: The percentage of facilities (by group) that are rated less than 3.0 on the Transit Economic Requirements Model (TERM) Scale
- Infrastructure: The percentage of track segments (by mode) that have performance restrictions.
2018 Targets
| Revenue Vehicle | FAX | FCRTA | Fresno COG | |
| Automobile | 0% | NA | 0% | |
| Bus | 3% | 47% | 8% | |
| Cutaway Bus | 0% | 18% | 10% |
**Target percentage of revenue vehicles (by type) that exceed the useful life benchmark (ULB)
| Non-Revenue Vehicle | FAX | FCRTA | Fresno COG | |
| Non-Revenue /Service Automobile | 3% | NA | 3% | |
| Trucks and other Rubber Tire Vehicles | 17% | 0% | 13% |
**Target percentage of non-revenue vehicles (by type) that exceed the useful life benchmark (ULB)
| Facilities | FAX | FCRTA | Fresno COG | |
| Administration | 30% | NA | 30% | |
| Maintenance | 30% | NA | 30% | |
| Passenger Facilities | 0% | NA | 0% |
**Target percentage of facilities (by group) that are rated less than 3.0 on the TERM Scale
Regional Transit Safety Performance Targets
There are three transit agencies in the Fresno County, Fresno Area Express (FAX), Clovis Transit, and Fresno County Rural Transit Agency (FCRTA). However, FAX is the sole agency in the region required by Federal Transit Administration (FTA) to develop the Public Transportation Agency Safety Plan (PTASP) and set the annual transit safety targets. Clovis Transit and FCRTA are exempted from the PTASP requirements. Hence, the regional annual transit safety targets would be same as that of FAX.
- VRM: Vehicle Revenue Miles
2020 Targets
- 2020 targets represent a 10% reduction of 2019 actuals.
- FY20 VRM are estimated at 5,130,000, an approximate 10% increase
| Mode | Fatalities | Fatalities (per 10 million VRM) | Injuries | Injuries (per 10 million VRM) | Accidents/Incidents | Accidents/Incidents (per 10 million VRM) | System Reliability |
| Bus Transit | 0 | 0 | 42 | 8.19 x 10⁻³ | 46 | 8.97 x 10⁻³ | 11,986 |