City of Clovis
Incorporated 1912
Fast Facts
- MAP
- p. (559) 324-2000
- f. (559) 324-2840
- info@cityofclovis.com
- www.cityofclovis.com
CITY COUNCIL
The Clovis City Council meets on the first, second and third Mondays of the month at 6:00 p.m.
*COG Policy Board Representative
| Title | First Name | Last Name | Phone | |
| Mayor | Vong | Mouanoutoua | VongM@ClovisCA.gov | (559) 324-2060 |
| Mayor Pro Tem | Diane | Pearce | DianeP@ClovisCA.gov | (559) 324-2060 |
| Councilmember | Matthew | Basgall | MBasgall@ClovisCA.gov | (559) 324-2060 |
| Councilmember | Drew | Bessinger | DrewB@ClovisCA.gov | (559) 324-2060 |
| Councilmember | Lynne | Ashbeck | LynneA@ClovisCA.gov | (559) 324-2060 |
| City Manager | Andrew | Haussler | AndrewH@ClovisCA.gov | (559) 324-2060 |
| Asst. City Manager | Paul | Armendariz | PaulA@ClovisCA.gov | (559) 324-2060 |
| City Clerk | Briana | Parra | BrianaP@ClovisCA.gov | (559) 324-2060 |
| Executive Assistant | Rebecca | Simonian | RebeccaS@ClovisCA.gov | (559) 324-2060 |
| Police Chief | Curt | Fleming | CurtF@ClovisCA.gov | (559) 324-2800 |
| Fire Chief | Chris | Ekk | ChrisE@ClovisCA.gov | (559) 324-2200 |
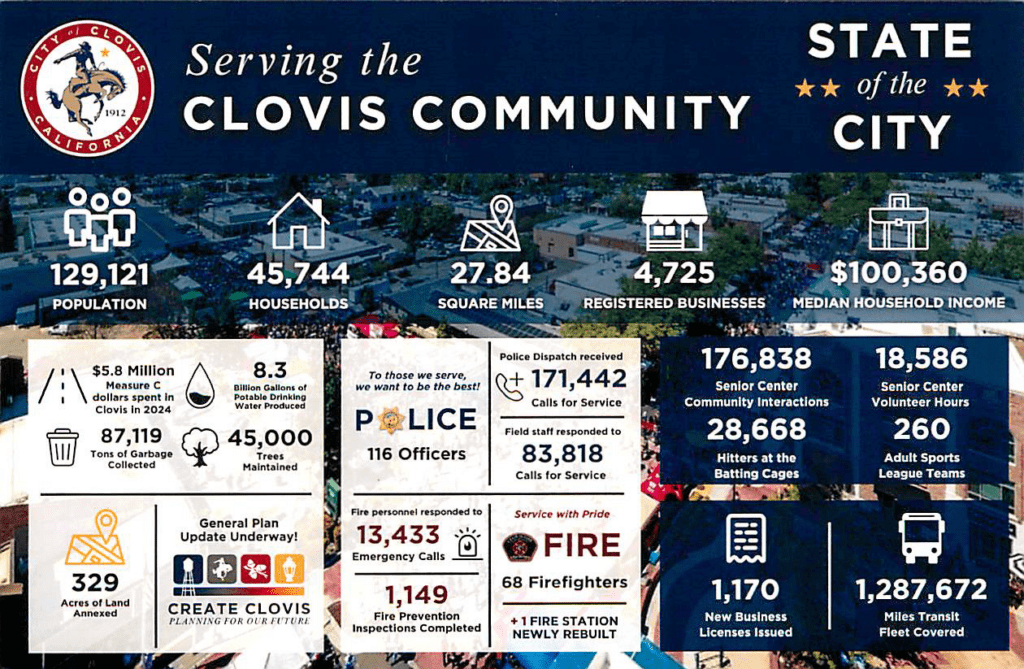
FAST FACTS
CLOVIS “A Better Way of Life”
Once home to ranchers, farmers, and the old mill at the end of Shaver Lake Flume, Clovis has become a community that provides a unique blend of rural and urban living. Clovis has achieved recognition as a “festival city” and celebrates Big Hat Days, the annual Clovis Rodeo and Parade, seasonal Farmer’s Market in Old Town Clovis, Clovisfest Music Festival, and Children’s Electric Christmas Parade.
Clovis is a community that supports families through excellent educational opportunities, responsive public safety services, clean streets and parks, and planned community growth to bring balance to the local economy and its residents.
Form of Government: City Council – City Manager, General Law City
Local Newspaper: None – Clovis Roundup shut down as of January 2026